 Headroom
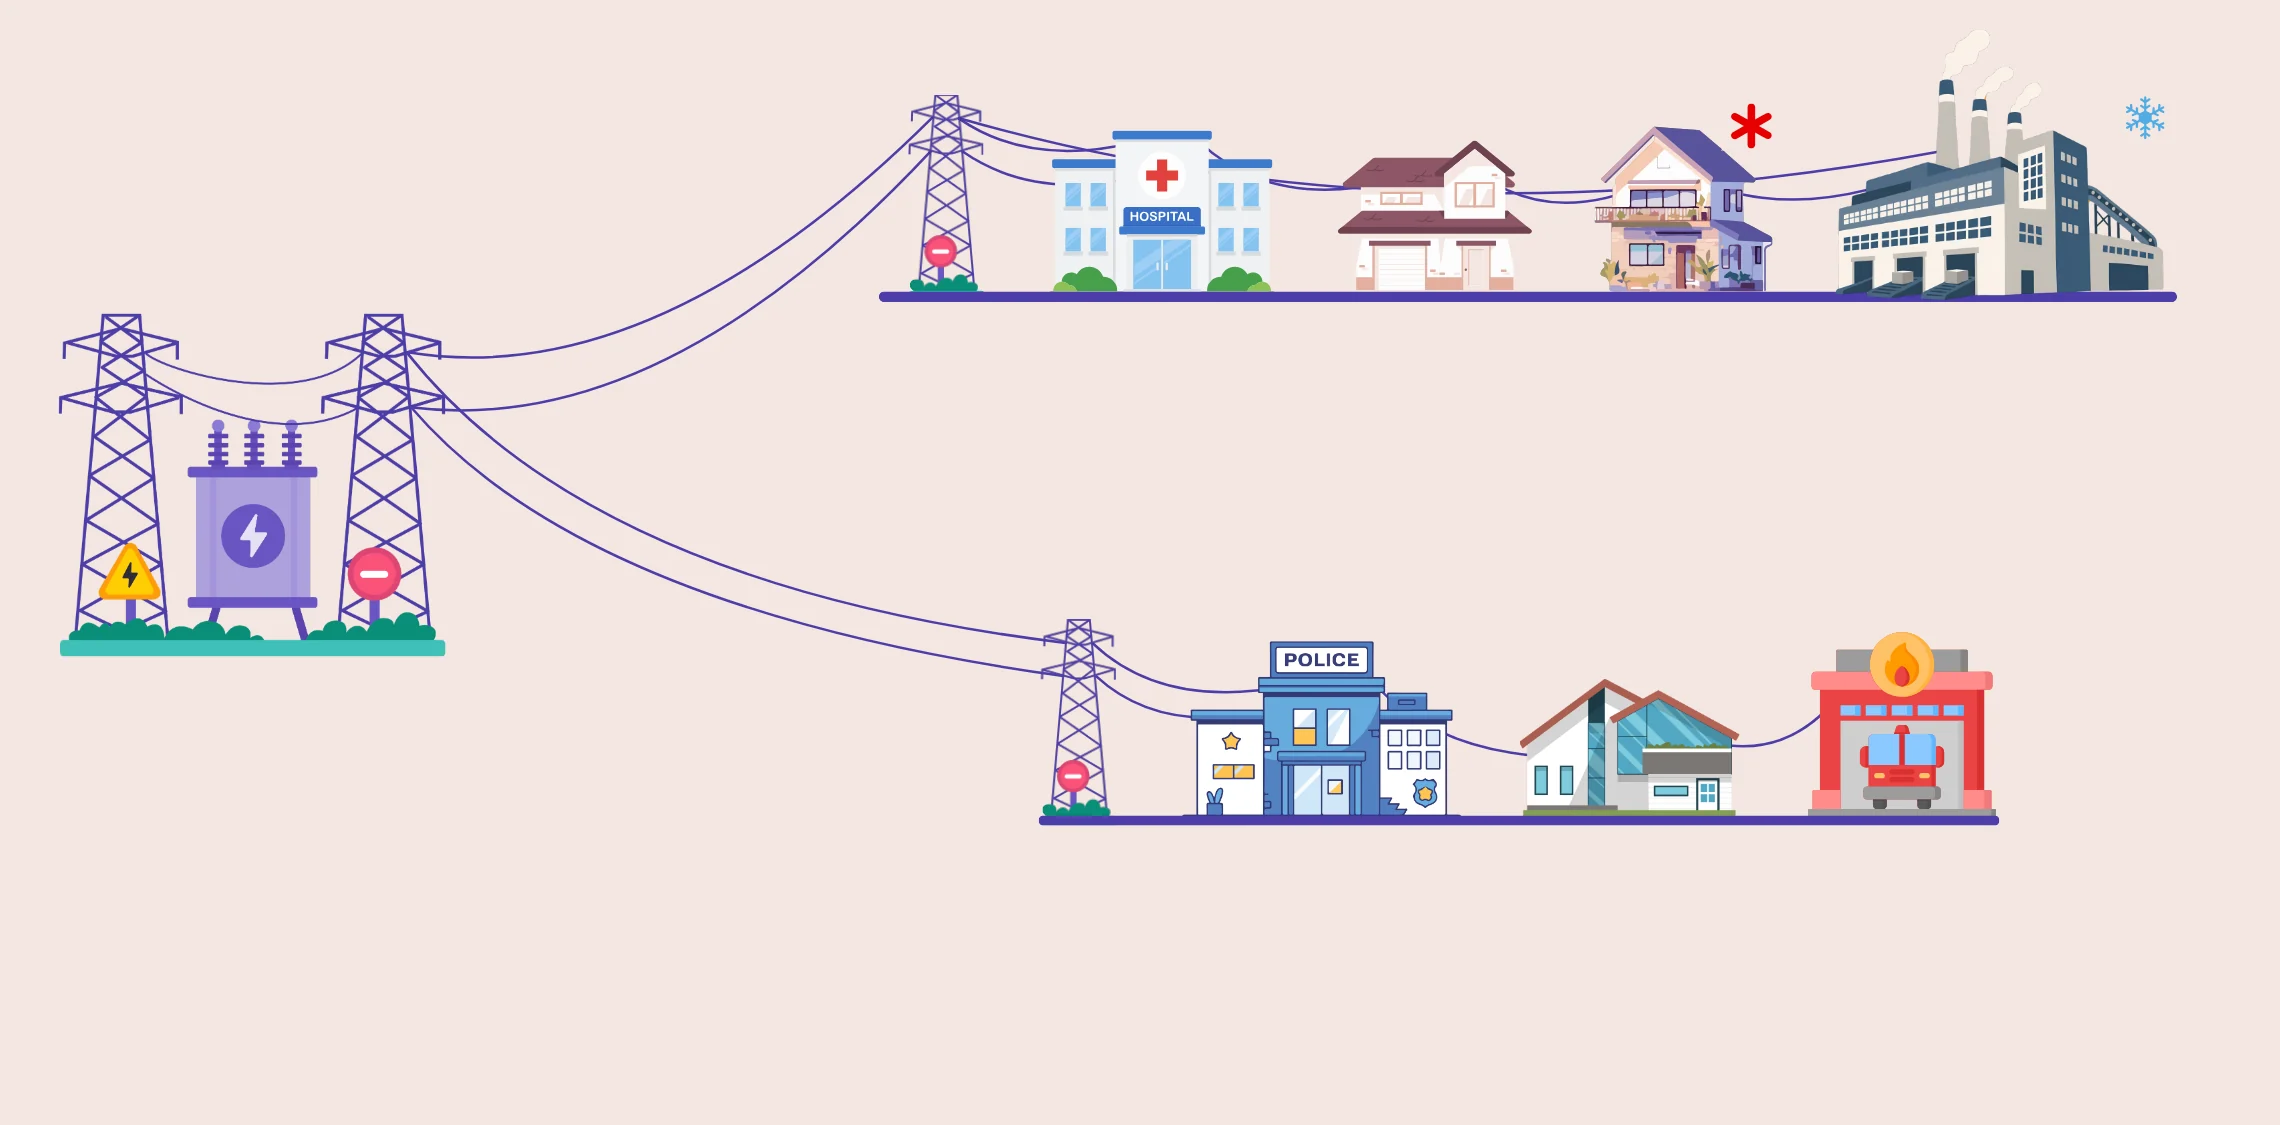
The line runs out of room
Heat lowers how much current the line can carry. Headroom pre-cools homes in the morning and trims them at the peak, so the line never overheats. Try the heat slider.
Disaster power allocation
Headroom keeps a power line under its heat limit, sends batteries and generators where they buy the most safety, and sheds load in a strict order: hospitals, then fire and 911, then homes with medical devices, then everyone else. It pays for every resource it uses and accounts for it after the storm.
Checking for a free simulation...
Each visitor gets a private, simulated town and a 72-hour storm: a heat wave that turns into a wildfire power shutoff. You can push it harder at any point.
Heat lowers how much current the line can carry. Headroom pre-cools homes in the morning and trims them at the peak, so the line never overheats. Try the heat slider.
Generators and the battery truck were reserved and placed hours earlier, where they buy the most safety. The hospital runs on its own generator. Press "Cut the line now".
Buildings move back onto the grid only as fast as the line has room, so it does not overload the moment it comes back. Headroom then settles every payment against metered data and writes the cost report.
A higher tier is never cut to keep a lower one on. The optimizer enforces it as a hard constraint, and a separate safety check repeats it before any switch moves.
Every 15 simulated minutes, it plans 2 hours ahead: which sites are connected, which run on backup, and how hard homes cool, all under the line's live heat limit.
15 min steps · 2 h horizon · hard priority
Every simulated hour, it plans 48 hours ahead over several possible versions of the storm: which generators to reserve, where to send the battery truck, and how much energy to hold back.
48 h horizon · weather and shutoff scenarios
It weighs reserving resources early against buying them late, pays homes and shops for the power they give up, and reconciles every payment after the storm.
double-entry ledger · reconciliation · cost report
Each policy runs on the same sampled storms. Lower is better in every column, and each bar shows a value against the worst policy in that column.
| Loading results... |
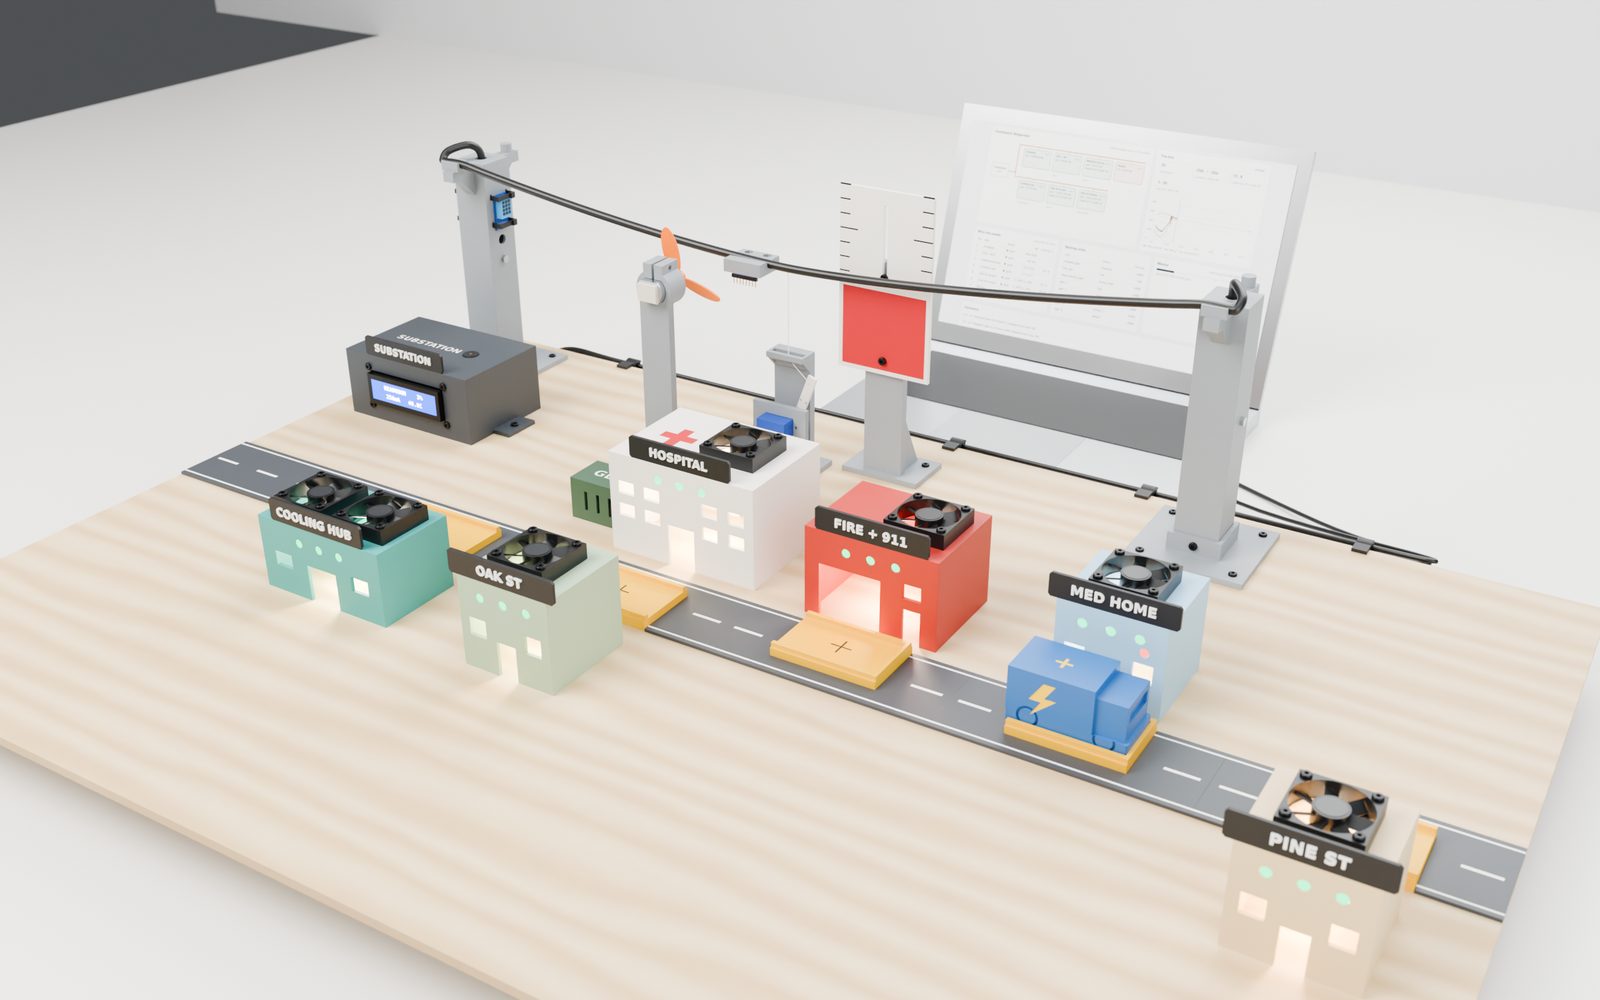
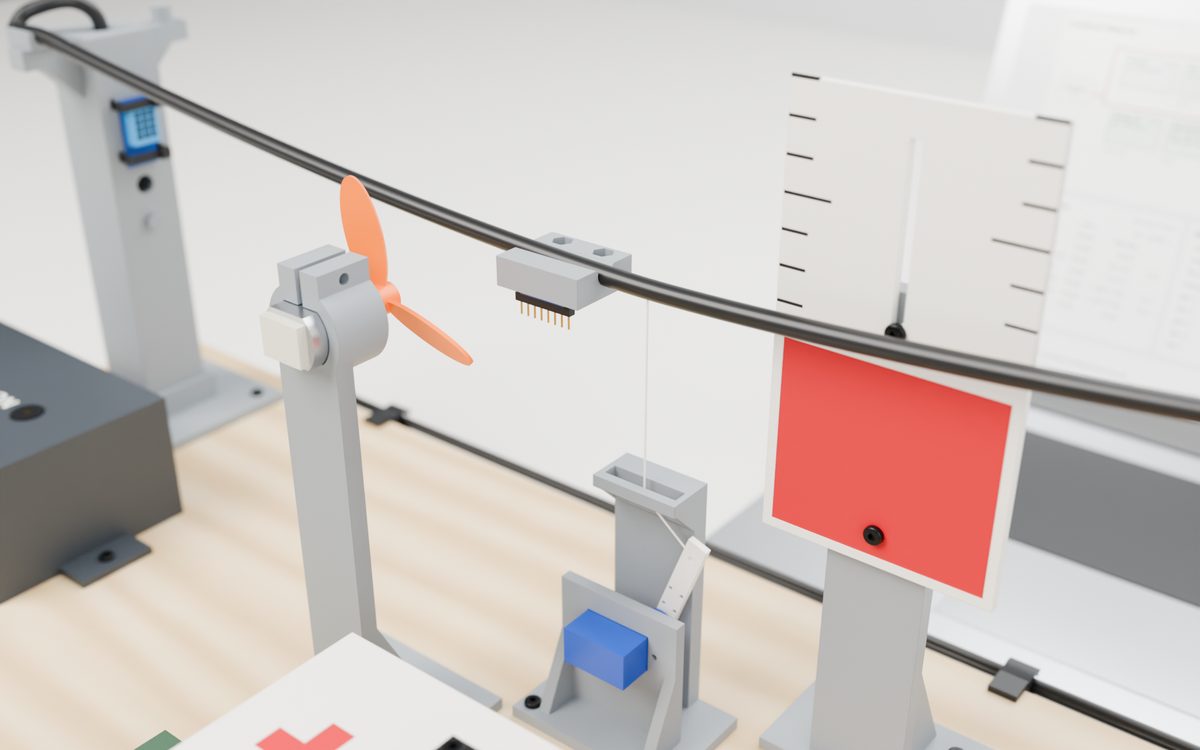
Every decision on this site comes from the real controller: the line heat model (IEEE 738), both planning loops and the finance layer. The town, its meters and the weather are simulated. The sliders stand in for the table's hair dryer, fan and flashlight.
Run your own storm